
Testwell CMT++
Verybench for Testwell CMT++
Graphically Monitoring and Evaluating Source Code Quality with Verifysoft Verybench
Graphically Monitoring and Evaluating Source Code Quality with Verifysoft Verybench Verybench is a graphical add-on for Testwell CMT++ Code Complexity Measurement Tool. Verybench allows managers, developers and testers to quickly evaluate a source code´s quality, maintainability and complexity over time correctly and understandable. For this, fine-granular complexity measurements in different scopes (file and function scope) can be performed. The results of these measurements (metric values) are then presented in a clear and aggregated form. These results can also be reported graphically in different file formats to others. Additionally, Verybench supports code reviews by dissolving complexity and presenting key aspects that are accurate and relevant to improve a source code´s quality.With Verybench You can:
- faster plan and perform code reviews and refactorings by just looking at graphical metric values, alarm limits or value distributions.
- faster and more accurate evaluate your source code´s maintainability status by the built-in Snapshot System of Verybench.
- better document and therefore verify your source code´s quality status by the built-in Code Quality Rating System.
- easier and more versatilely deliver crystal clear reports of your soure code's quality to others.
Dashboard Views
The Dashboard Views were built to show information about all metrics offered by Testwell CMT++ that can be measured in file and function scope. Several sub views show different aspects of these metrics and their relationships.Snapshots Overview
The Snapshots Overview discretely shows measured source code over time by presenting the latest 6 snapshots of the current main project. A snapshot´s alarm ratios are calculated by summing up all alarms in file and function scope. Did a measured source code not produce any alarms, it is considered high quality code and is rated. Then it does not need to be improved any further. The view consists of the Snapshots Overview (left hand side) and the Code Quality Rating (right hand side).Alarm Limits Overviews
Testwell CMT++ defines alarm limits for most of its metrics. This is because they build a controlling system that allows see when a particular metric is off alarm limits. These alarm limits you can configure freely with Verybench and suit to your project´s needs. The Alarm Limits Overview shows on an axis for each metric the average deviation of the calculated metric value to its set alarm limits. Additionally, all current metric values and alarm limits are shown again in form of a table (colored by Min., Max., Avg.) at the right hand side of the view.Distributions Overviews
These views show distributions (histograms) of files and functions on intervals of metric values (classes). All files or functions whose metric values are within alarm limits are painted green, others that are off alarm limits are painted red. By this, a quick overview over the distribution of values across files and functions of the latest snapshot is possible. The distribution of metrics for file and functions scope is calculated for:- V (Program Volume)
- c% (Comment Ratio)
- LOCpro (Lines of Program Code)
- v(G) (McCabe Cyclomatic Complexity)
Metrics View
The Metrics View shows all measured metric values (raw values) and marks alarmed ones red. There is also the possibility to filter metrics and e.g. show only the ones that were alarmed or not alarmed. Moreover, you can zoom directly into function scope from file scope and back to always have an overview over all metric values. Additionally, the source code of each file or function is shown (read-only) to better understand why a particular metric value was calculated and how the particular source code looked that produced it.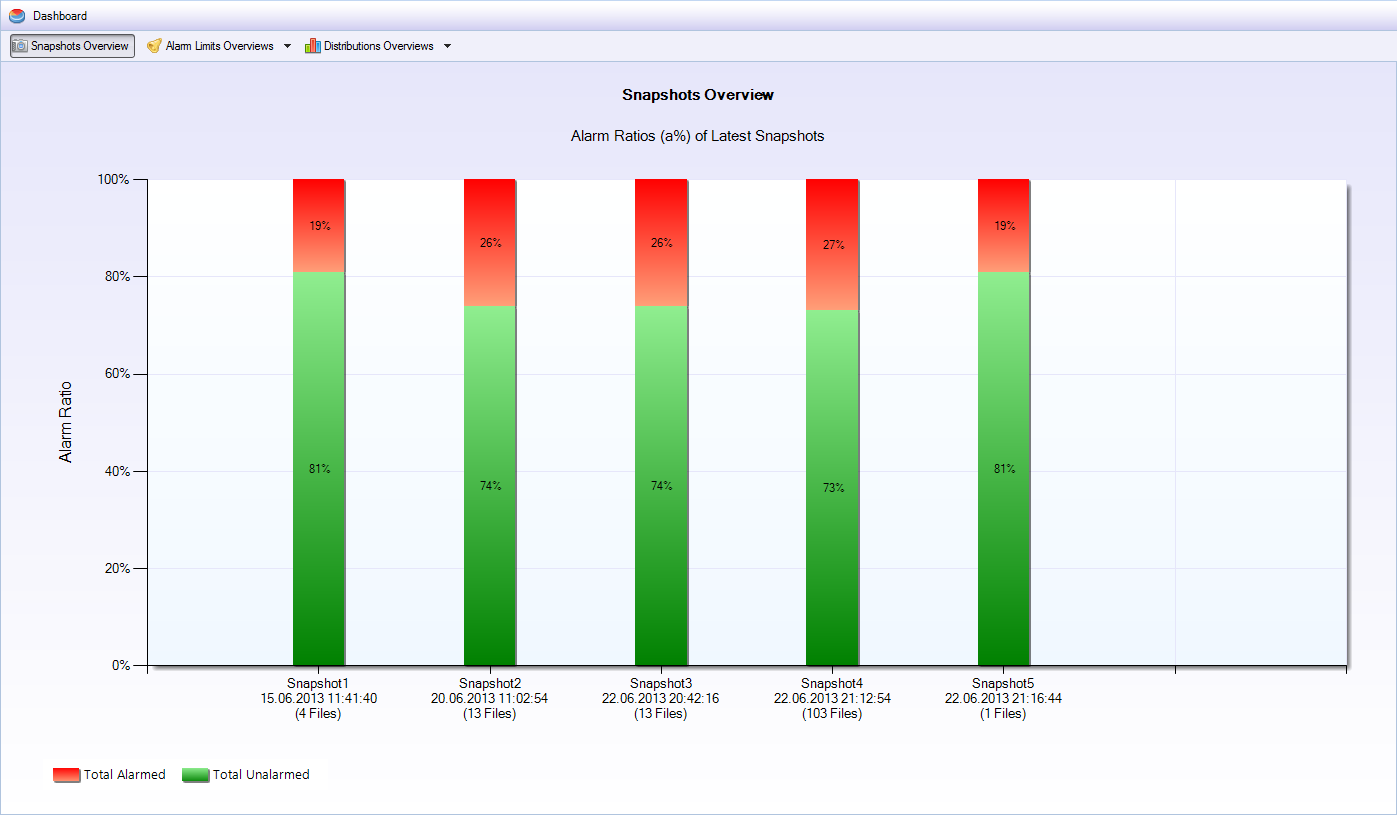 Snapshots Overview to qickly identify a source code's quality.
 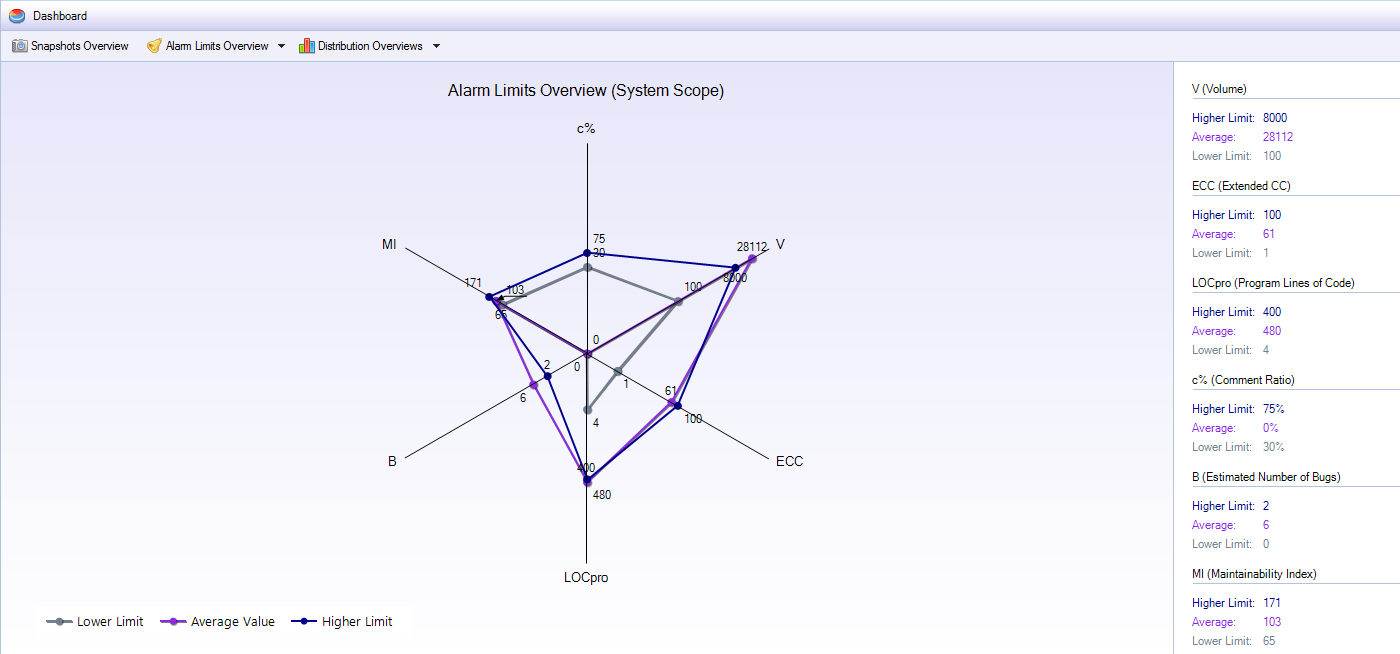 Alarm Limits Overviews to qickly identify all metric values (averaged) that are off set alarm limits.
 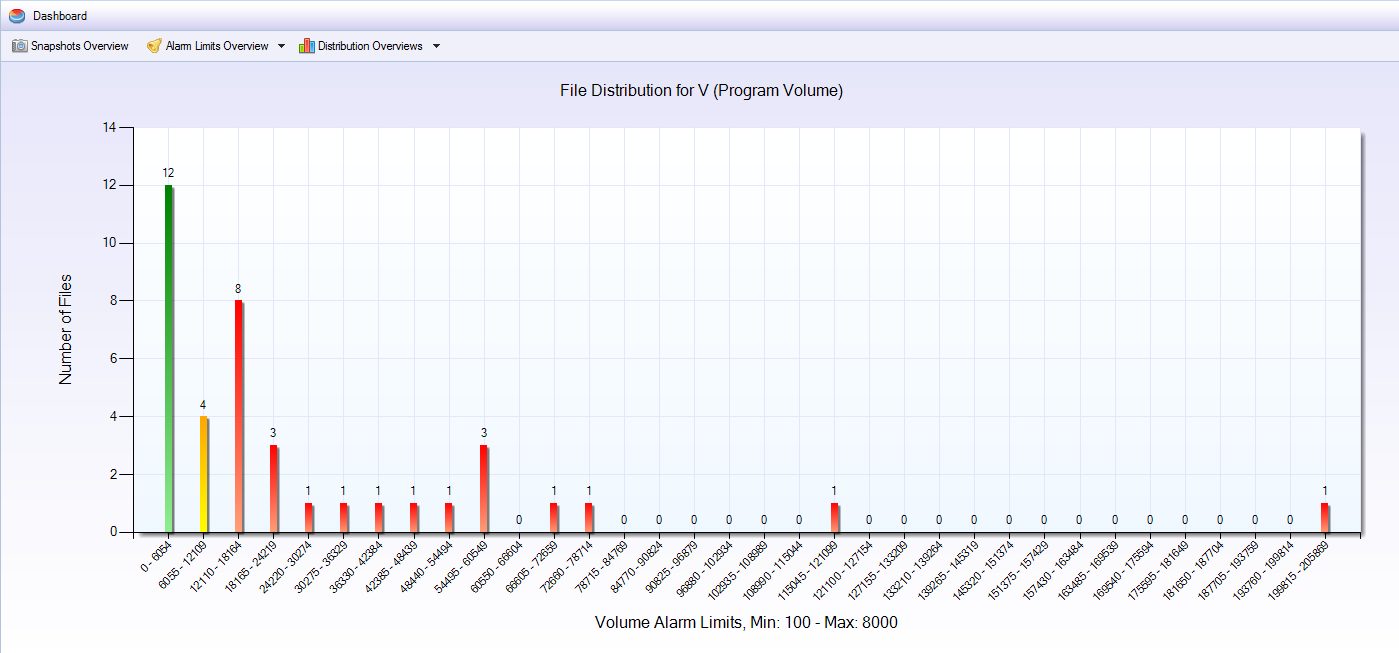 Distributions Overviews to qickly view all files´ or functions´ distributions on all metrics in file or function scope.
 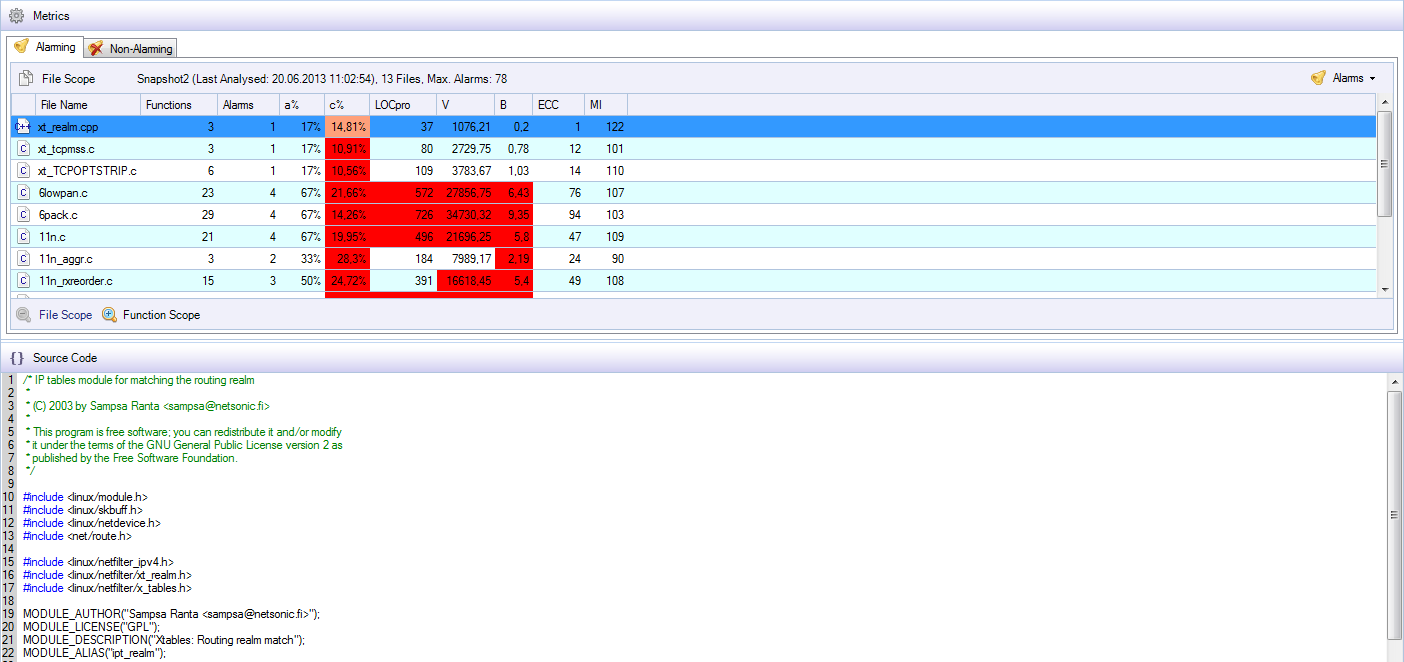 The metrics view to quickly see all metric values calculated with corresponding source code.
Reports
With Verybench complexity reports of the following formats can be generated easily:- HTML
- XML
- TXT
- CSV
Installation Requirements
- Microsoft Windows 7 (32bit/64bit)
- Microsoft .NET 4.0
- Valid license of Testwell CMT++ 5.0